Finding the Slowest Query using the Execution Plan
-
Posted on September 10, 2010 by Derek Dieter
-
0
If you’ve stumbled upon this post, then you’re likely at a point where you’ve got a crap query that is slowing you down. This article tells you how to find that one slow query, within a procedure.
You also probably know that the execution plan is what you need to use to find out how to fix it, so let’s set that up.
First, enable the execution plan:
- From the SSMS menu, select: Query » Include Actual Execution Plan
Ok, so there you’ve enabled it for the session (or window). It is going to be enabled until you close the window or turn it off.
Now let’s execute this procedure and see what is slow.
[cc lang=”sql”]
EXEC dbo.MyCrappyProcedure
[/cc]
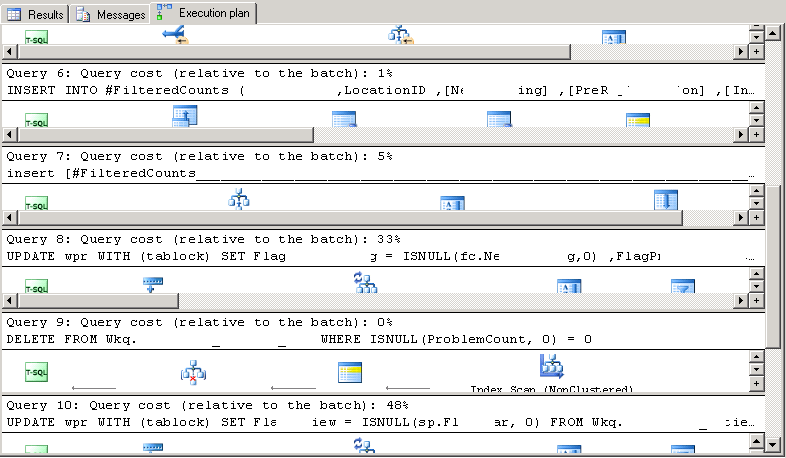
Ahh.. so now that I’ve executed the procedure and it completed, I see this new weird tab on the output pane labeled “Execution Plan”.
Select on this new tab.
You should see something like this:
Now let’s look at each section that states:
Query x: Query cost (relative to the batch): x%
Hmm.. so if the entire procedure equals 100%, then each of these individual SQL statements shown equal the other x% that is shown?
Yep, that’s how it works; on paper at least.. The cost is somehow calculated by SQL Server by probably combining resource usage (CPU, IO, Time etc.)
So that’s how you find the most offending SQL Statement. Now in order to begin the troubleshooting it you’ll have to look at the execution plan for that statement.
- Comments (RSS)
- Trackback
- Permalink


