Execution Plans
-
Posted on September 11, 2011 by Derek Dieter
-
0
The execution plans SQL Server creates and uses is a huge topic with many intricacies. Now I have never spoken to anyone on the SQL Server Development team, however I would imagine that there are some extremely sharp people in the query optimization team. In a nutshell, this is where the magic happens in SQL Server.
Overview
An execution plan is a behind-the-scenes look at the road a query takes in order to deliver it’s final result. They are generated from the underlying data statistics combined with what the query and it’s parameters are trying to accomplish. When the initial query is read, the execution plan generation engine or “Query Optimizer” searches for the best way to deliver the results of the query in the quickest way possible. To do this, it needs to know what the underlying data looks like. This is facilitated by the statistics that are stored for each table, column, and index. With these statistics in hand, the goal is to eliminate the largest number of records as quickly as possible, and iterate through this process until the final result is delivered. That said, it is not an easy job. There are many variables that come into play when determining a query’s path. A few of these include the selection of indexes, join algorithms, join order, parallelism.
Displaying the Plan
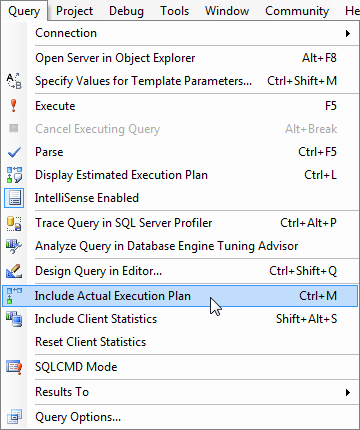
As SQL developers, it is our job to understand how to read execution plans so we can see how the query is being executed. To view an execution plan for a query, select query -> Include Actual Execution Plan. (Or just hold ctrl + M)
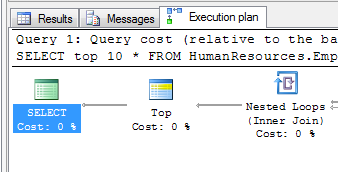
Now, the execution plan will be displayed for all queries within this session, until you turn it off. Execute a query and you will see a new tab next to your results that says “Execution Plan”.
Reading
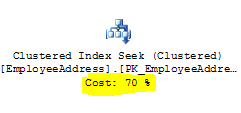
Read the execution plan from right to left. The first paths the query takes are on the right hand side and extend all the way to the left until it gets to the final node. A cost percentage is assigned to each operation.

This gives you a relative understanding of how expensive each operation is for that query. Sometimes this will lead you to find a missing index, modify an existing index, or even break the query up into multiple parts. The cost can sometimes be misleading though. It is not always that the most expensive operation is the slowest or most intensive.
Hovering your mouse over each operation will display additional details about each operation.
These drill downs include valuable information including the index or object being referenced, the columns that are output by the operation, the predicates (or filters), estimated and actual statistics.
Missing Index Hints
Many times, the execution plan will give you hints about what index could be added to speed up the query. You’ll see this at the top of the execution plan in green text.
In order to view the details of the missing index, right click on the green text and choose “missing index details”. This will open a new window with the create statement for the index.
Conclusion
Sometimes, the optimizer will not choose the best execution plan it could for a query. This can be due to a number of reasons, but personally, I try to take those reasons away from the optimizer by breaking my complicated queries up into multiple queries and using temp tables. This helps relieve the optimizer from making bad decisions. With a good amount of practice, you can begin to correlate how the query is written with the way the execution plan is laid out. This does take a lot of trial and error, so don’t be scared to change things like join orders, break things out to temp tables, use exists instead of joins.. This is the best way you will learn what is most efficient.
- Comments (RSS)
- Trackback
- Permalink
Question about breaking up queries into smaller ones: Do common table expressions do this as well? I have at work many views with joins on nested queries, often 2 deep or more. I think CTEs “might” improve performance.
Hi derek,
excellent blogs for all dba’s and developers. i need more performance tuning tips and tricks with wizard. so could you please send me Troubleshooting URL’s to my email. Thanks in advance.
[…] 本文介绍如何查找存储过程中性能较差的查询脚本。首先,需要启用执行计划(Execution Plan) — 包括实际的执行计划(Include Actual Execution Plan)。 […]


