Comparing Query Performance
-
Posted on August 16, 2011 by Derek Dieter
-
1
If you write TSQL then comparing the performance of two queries will probably be something you do on a daily basis. The difficult part of comparing queries is getting an accurate baseline. Why is this you ask? Because SQL Server has behind the scenes functionality that optimizes queries for multiple executions. This allows minimal resources the second time a query is run. This is why often times, you will notice the second run can be considerably faster than the first.
There are a few features that make this happen.
Plan Caching
Immediately prior to the execution of a query, SQL Server needs to determine the best route to take for the query. This includes the indexes to use, the order of the tables to reference, the types of join algorithms to perform, and many other factors. Finding this route is a rather expensive process, so instead of performing this every time a query is ran, SQL Server caches the plan in memory so it can be reused. Naturally, the second time the query is run, it will be quicker because it does not have to determine the execution plan.
There are two ways to clear a plan cache. You can nuke all plans on the instance using DBCC FREEPROCCACHE with no parameters. Or you can pass in the parameter of the plan handle to clear.
Just running the following command will clear the plan cache on the entire instance
[cc lang=”sql”]
— Clear the instance
DBCC FREEPROCCACHE
[/cc]
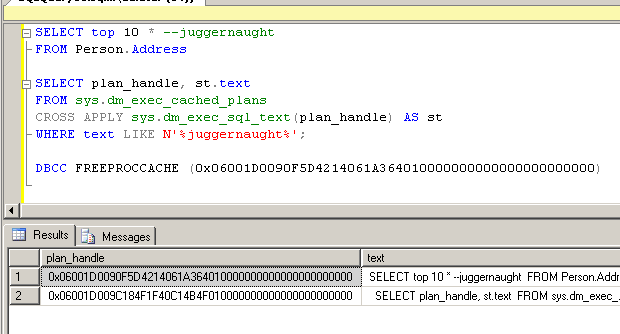
This will clear the plan cache for a particular query. Note that the plan cache DMV will store the entire query text, including comments, so if you execute the query with a bizarre comment, you can find the query using the bizarre comment.
[cc lang=”sql”]
— Run the query
SELECT top 10 * –juggernaught
FROM Person.Address
— Retrive the plan Handle
SELECT plan_handle, st.text
FROM sys.dm_exec_cached_plans
CROSS APPLY sys.dm_exec_sql_text(plan_handle) AS st
WHERE text LIKE N’%juggernaught%’;
— Clear the Plan cache for this handle
DBCC FREEPROCCACHE (0x06001D00663FE80140E1DFDE000000000000000000000000)
[/cc]
Buffer Caching
The buffer cache stores the table data retrieved from physical disk into memory. The buffer cache typically saves far more time on an execution when compared to the plan cache. Where the plan cache will save somewhere between 5 – 400 milliseconds, the reuse of the data stored in the buffer cache can sometimes shave off many seconds. This is why a lot of times when comparing queries, I will only reset the buffer cache unless the query is going to have many executions / sec.
To drop the buffer cache is not pretty. You have to drop all the buffer cache memory for the instance of the SQL Server. Do not do this in prod, unless you want your disk to be overwhelmed.
[cc lang=”sql”]
— Drop all the buffers
DBCC DROPCLEANBUFFERS
[/cc]
There, that command will level the playing field when comparing two different queries.
Network Traffic
If you compare your queries according to the run-time you see at the bottom right of the screen, then you are looking at the client-side time. This is the time it takes your client to receive the data. Though it is usually not significant, sometimes network traffic can have strange effects when trying to derive a baseline. This is why when comparing queries, I like to turn on the server-statistics an compare them.
To do this simply run
[cc lang=”sql”]
SET STATISTICS TIME ON
[/cc]
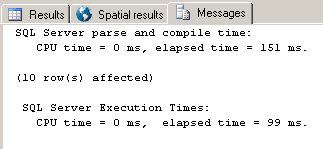
Once turned on, it will be on for the entire session (or until you close the window). To view these statistics, run the query, then click on the “Messages” tab in the result pane. There you will find the times for compilation, and the execution times for each batch.
Disk Usage
Along with server-side time statistics, it is also beneficial to pay attention to the server-side IO statistics. These are turned on almost the same as turning on the time statistics.
[cc lang=”sql”]
SET STATISTICS IO ON
[/cc]
Once on, the “messages” tab will show the IO stats for the query. The one thing to pay particular attention to is physical and logical reads. Physical reads mean the hard disk is being accessed, while logical reads mean the buffer cache is being accessed. You can level the playing field by freeing the buffer cache using the method above.
- Comments (RSS)
- Trackback
- Permalink
Hi Derek, this is an awesome article. I have one question for Buffer Caching.
Is that possible to drop the buffer that’s only related to the SP I am working on?
The method you proposed below is pretty much unrealistic as nobody will drop all buffer on any server as it will cause huge griefs on other team members.
— Drop all the buffers
DBCC DROPCLEANBUFFERS
Thanks
H


