Activity Monitor
-
Posted on July 23, 2009 by Derek Dieter
-
0
The Activity Monitor is a new feature in SQL Server 2008 that provides high-level and drill down information giving good insight into the performance of SQL Server allowing DBA’s to quickly identify the source of slowdowns.
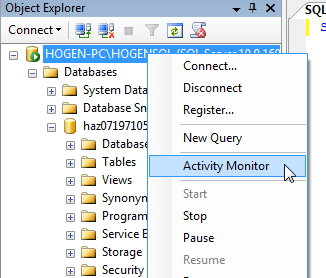
To launch the activity monitor, right click on the instance name in SSMS and select ‘Activity Monitor’.
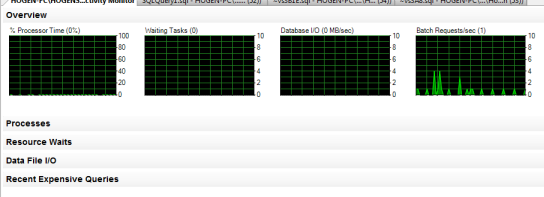
This launches activity monitor in the right hand workspace window. There are 5 main sections to help provide monitoring:
- Overview – Graphical overview of Processor, Wait Tasks, I/O, and Batch Requests.
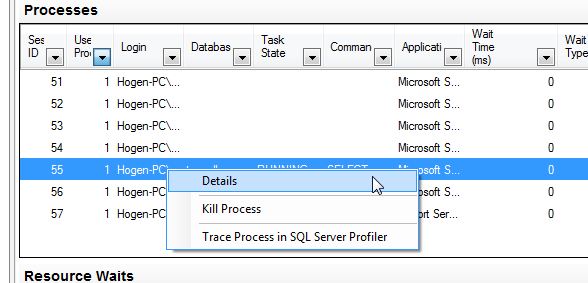
- Processes – Provides an overview similar to sp_who2, however is sortable by category and contains context driven actions.
- Resource Waits – High level overview of the wait time statistics aggregated from sys.dm_os_wait_stats
- Data File I/O – Provides latency and read/write statistics for each data and log file in the system.
- Recent Expensive Queries
All statistics provided are from the SQL Server DMVs in a very convenient easy to use UI. This covers all potential SQL Server bottlenecks except possibly Network IO. And gives you a great initial overview in what you should be drilling down to in order to find a performance issue.
Processes
The next section is Processes. This is similar to sp_who2 however it is sortable on every column, provides lead blocker information and also has a context menu providing additional options of details (dbcc inputbuffer), kill, and trace in profiler.

Resource Waits
The resource wait section displays aggregated information on the wait statistics from the DMV sys.dm_os_wait_stats. Resource waits relate to the subsystems that are acting as the biggest bottlenecks for your queries.

Data File I/O
This will show the high-level usage of the data files so you can see how much activity is happening in each database. Using this information you can focus on the high throughput databases.

Recent Expensive Queries
The last section shows the recent queries that may have been attributed to a performance slowdown. You can sort by CPU, Physical Reads (disk reads), Logical Reads (Memory Reads), Logical Writes (Memory Writes) Average Duration, and plan count (how many plans are associated with the query. The right-click context menu allows you to copy the query to a new query editor window for analysis, or you can also view the execution plan.

- Comments (RSS)
- Trackback
- Permalink


